Enterprise Software / Buyer’s guide
Before You Build a Dashboard, Agree What the Numbers Mean
Scope a business dashboard with clear metric definitions, data freshness and acceptance evidence. Includes a reporting matrix and a worked example.
The short answer
Start with the decision the report supports. For each important metric, agree what one record represents, which states count, which date and time zone apply, the units, data freshness and who may inspect the detail. Then ask the supplier to reproduce expected results from an agreed sample. A dashboard is ready to accept when its figures can be explained and checked—not merely when its charts look complete.
Discuss your project ↗
Our take
The valuable deliverable is not a wall of charts. It is a small set of numbers whose meaning survives a question from the people who run the business.
In this article
01 / 07
Two teams can read the same chart and answer different questions
Imagine a weekly operations meeting. Sales wants to know how many orders arrived. The delivery team wants to know how many shipments left. Finance wants to know which invoices were paid. A screen labelled ‘This week’s sales’ seems to satisfy everyone—until someone asks what it actually counts.
This is an illustrative situation, not a client story. It points to a practical commissioning problem: a familiar label is not a calculation rule. An attractive interface can conceal a disagreement that software cannot settle on its own.
Before choosing chart types, finish this sentence: When this report shows a change, this person will make this decision. A queue for assigning overdue work needs record-level detail and an action path. A monthly review may need stable comparisons instead. They need not be the same screen.
Axiom Forge’s recommendation is to scope the smallest useful reporting view around that decision. If the operating process itself is unclear, resolve it during product discovery, rather than asking a designer to invent the business rules.
02 / 07
Give each important number a definition the business can sign off
A metric definition can be short. It needs enough detail for a second person to reach the same answer from the same records. The following matrix is our suggested briefing aid, not an industry-mandated template.
| Decision to record | What to agree | Question it prevents |
|---|---|---|
| Purpose and owner | The decision, its audience and the person authorised to approve the definition. | Who can explain or change this metric? |
| Unit of counting | One order, order line, delivery, customer or another named business record. | Are we counting the same thing twice? |
| Included states | Which statuses count, and how cancellations, reversals and incomplete records behave. | Does submitted mean accepted? |
| Time basis | The event date, reporting time zone, period boundary and treatment of late changes. | Does this belong to this week or last week? |
| Amount and units | The amount field, tax and discount treatment, currency and any conversion rule. | Are these values genuinely comparable? |
| Freshness | The source coverage, refresh expectation and what happens when updates fail. | Is this current data or a recently opened page? |
| Detail and access | The permitted filters, drill-through records and export boundary for each audience. | Can this viewer verify the total safely? |
| Acceptance evidence | A reference sample, expected result, allowed tolerance where justified and definition version. | How will we know the calculation is right? |
Not every product needs a large metrics catalogue. Start with the figures that affect a real decision. A collection of approved definitions is more useful than fifty loosely specified widgets.
03 / 07
One order can become three rows without becoming three orders
Consider a fictional order, O-104, with an original value of $120. It ships in three deliveries. A reporting query joins the order to the delivery records and returns three rows, each carrying the order’s $120 value. Summing that repeated field now displays $360. The underlying order has not increased in value.
The issue is the grain: what one reporting row represents. Microsoft’s Power BI modelling guidance recommends a consistent grain for fact tables. Tableau’s join troubleshooting documentation likewise describes how one-to-many joins can over-count a value. These are documented modelling concerns, not reasons to prefer one reporting vendor.
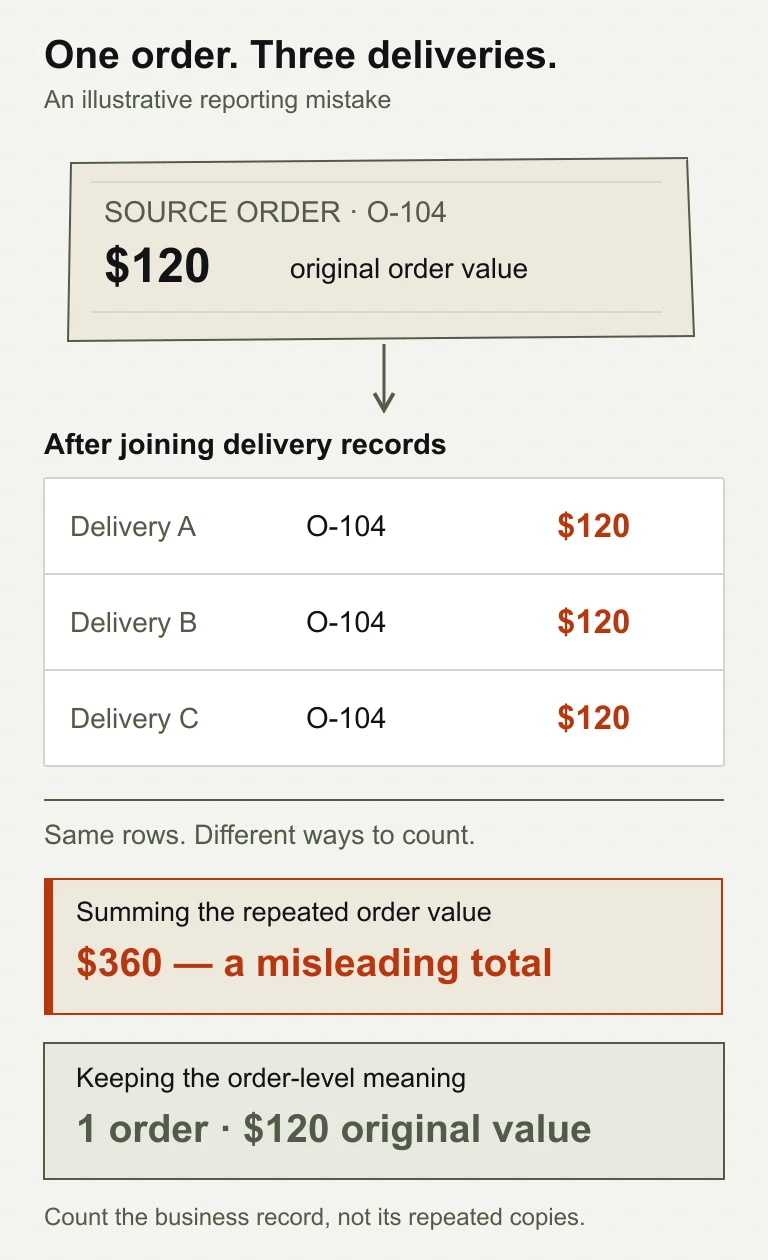
Ask the supplier to demonstrate the total at the agreed business grain and show the relationship to the detail. Counting distinct order IDs may fix the order count; it does not automatically fix every amount. Nor is summing distinct monetary values a universal remedy: two different orders can legitimately have the same price.
The buyer does not need to dictate SQL. The requirement is a reproducible answer, including the awkward one-to-many example—not just a chart that agrees with a clean demonstration dataset.
04 / 07
‘This month’ and ‘up to date’ both need a boundary
An order placed near midnight, shipped the next day and paid the following month belongs to different periods depending on the question. Name the date field and reporting time zone in the definition. A date filter labelled only ‘Month’ leaves too much to guess.
Microsoft’s modelling guide distinguishes order, shipment and delivery date roles. The commercial decision is yours: choose the event that matches the report, and label it accordingly. An orders-placed report is not automatically a cash-received report.
Also decide whether a past period is recalculated when a late cancellation or correction arrives, or whether an approved snapshot is retained. Neither behaviour should be discovered during a management review. Formal financial reporting may need additional accounting controls and qualified advice; an operational dashboard is not a substitute.
Freshness is a separate promise. In Power BI’s documented Import behaviour, refreshing a visual queries the imported model; it does not itself fetch new source records. Other architectures have different refresh paths. Ask which path your product uses, what source period is covered and how a failed update is shown.
Our recommendation: distinguish the latest successful import from the period the source actually covers. If the upstream export stopped yesterday, a successful import of that unchanged file should not look like proof of current operations.
05 / 07
Put the report where the next action belongs
Inside the business application is often the useful place for a bounded operating queue: inspect the record, assign responsibility and continue the work. The trade-off is that every additional reporting rule becomes part of the application’s scope and maintenance.
A separate BI tool may suit cross-system analysis and changing management questions. It still needs owned definitions, a trustworthy data model, access controls and a refresh arrangement. Connecting a tool does not remove those responsibilities.
A governed export can be a proportionate first release when the audience is small and the analysis is occasional. Its costs include manual handling, copy proliferation and the risk that a spreadsheet quietly becomes the authoritative report.
These are Axiom Forge’s delivery trade-offs, not a platform ranking. Compare the options against the decision, expected users, source systems, operating cost and who will maintain the definitions. A hybrid can be sensible, provided the same metric does not acquire a different meaning in each place.
For sensitive detail, agree the record and export permissions explicitly. A department-only viewer may correctly see a different total from an organisation-wide viewer. The interface should state that scope rather than imply a broken calculation.
06 / 07
Accept a small set of explainable answers before a wall of charts
Prepare a safe reference dataset with the business owner. Use synthetic or appropriately protected records; do not send confidential customer exports through a public project form. For each case, record the expected result, relevant filters and definition version before the supplier demonstrates the report.
- Repeated detail: one order with several delivery records does not multiply the order count or repeat its total.
- Period boundary: records on either side of the agreed time-zone cutoff appear in the expected periods.
- Changed state: a cancellation or late correction follows the documented historical rule.
- Zero versus missing: no activity and unavailable data are distinguishable rather than silently shown as the same zero.
- Units: incompatible currencies or units are not silently added together.
- Stale source: a failed refresh exposes the freshness limitation and its operational owner.
- Restricted viewer: totals, detail and exports respect the same agreed audience boundary.
Follow a summary into its permitted underlying records and reconcile the result. If rounding or currency conversion requires a tolerance, state its reason and calculation; do not use an unexplained percentage to excuse a mismatch.
Keep the sample, observed outputs and unresolved differences with the acceptance record. This is proposed verification work for the commissioned product—not a claim that any live customer system has passed it.
07 / 07
Buy the definition, the data path and the handover—not only the screen
A reporting estimate should identify the source systems and access dependencies, metric definitions, necessary modelling or cleanup, interface, refresh process, acceptance evidence and ongoing ownership. Historical reconstruction, missing identifiers or incompatible units can materially change the work; they deserve investigation before a fixed promise.
After launch, give definition changes an owner and a visible version. If the business changes what ‘active customer’ means, old and new periods may no longer be comparable. Record that change rather than allowing an unexplained jump to masquerade as business growth.
For a useful first conversation about custom business software, bring the decisions the report must support, a list of source systems, an anonymised example of the present report and the places where teams disagree. We can then discuss whether the right first step is a focused report, integration work or discovery—not assume that every reporting problem needs a new platform.
Send a project brief or write to hello@axiomforge.am. Share the workflow and constraints, not passwords or confidential customer records.
Sources and editorial scope
This is Axiom Forge’s procurement and product-delivery guidance, not a guaranteed project plan. The example is illustrative. Sources checked on 15 Oct 2026.
- Microsoft Learn — Understand star schema and its importance for Power BI — Consistent fact-table grain and distinct date roles; product-specific modelling guidance, not a required platform choice.
- Tableau Help — Troubleshoot joins — Documents over-counting caused by joined records; our order example is independently constructed and illustrative.
- Microsoft Learn — Data refresh in Power BI — Distinguishes data refresh from visual refresh, including Import-mode behaviour; no universal refresh SLA is inferred.